
I built this app for two reasons: 1) I wanted to better understand how the wifi signals in my neighborhood interacted and whether there was anything to optimize in my home setup, and 2) to play with the Wio Terminal by Seeed Studios.
The hardware
The Wio terminal is an impressively-capable device for embedded systems hacking, with a lot of interesting peripherals to play with, in a small (3″ x 2.25″) form factor, and only $36.
The main processor is an ATSAMD51 (ARM Cortex-M4) MCU, the same as in the Adafruit Feather M4 Express, which I used successfully in my art project “You Don’t Have to Like All the Art!” at Burning Man this summer. At 120 MHz, with 192KB RAM, and 512KB flash, there’s a lot of processing power and generous space to write complex code without needing to count every byte.
However, that’s where the similarities end. The Feather M4 Express is a naked PCB that gives you the MCU, some power management, some SPI flash memory, and GPIO pins to use as you’d like. (Ok, also a Neopixel and an LED as peripherals.)
The Wio terminal comes in a compact plastic case with an embedded 2.8″ 320×240 pixel LCD, 3 buttons on top, a 5-way “hat” control button, a separate RTL8720DN MCU managing both 2.4 GHz and 5 GHz wifi connectivity, and loads of peripherals (gyros, a light sensor, IR, buzzer, microphone, even a freaking SD card slot). And its GPIO pins are arranged so that you can easily stack it on top of a Raspberry Pi for a dual system if you want.
Best of all, it’s actually respectably well-documented in a wiki that I found made it easy to get started.
You can built a lot of neat little tools with this without needing to pull out a breadboard! Just write an Arduino program, flash it over the USB-C port, and you’re ready to go.
Graphics
I actually spent most of my time on this project working on a graphics library to make the user interface. The wiki pointed you to a git repo for access to draw on the display, but this was fairly low level (drawing lines, rectangles, pixels, etc.). One higher-level feature it had is the ability to draw text in one of several configurable fonts, which was nice.
On the other hand, the code in this repo is… scary. (.cpp files including other .cpp files? in the middle of a class { ... } definition?!) It’s also a fork of this other TFT_eSPI library that has by this point diverged by a large number of commits. I spent some time cleaning up my local copy of this for my own sanity, as part of learning how it works.
The LCD has its own memory, so you don’t need to allocate a framebuffer. (Which is good, because 16 bit color @ 320×240 would be 150KB, or 78% of the available RAM!) On the other hand, that means you either need to do your rendering very fast, do it all during the VBlank period, or accept some flickering on the screen while you draw. And unfortunately, I couldn’t find a way through that library to wait for the “back porch” period to begin to know when I had a window to write to the VRAM without causing screen tearing.
I wound up creating this lightweight uiwidgets library that did a few things for me:
- Defined a collection of reusable widgets (Label, Button, VScroll, etc.) that let me reason about the interface in familiar GUI terms and decouple that from the drawing of each pixel or character
- Provided a grid-based layout manager to direct where the widgets went
- Let me define style properties for widgets in an object-oriented style, like Tk
- Helped with redrawing only the minimal area of screen necessary when a widget’s state changed in a way that needed to be reflected on the GUI
The widgets in the library all have a parent widget (except for the root-level Screen object). Widgets each take up as much space as are available to them, horizontally or vertically. When a widget is resized, it then resizes in turn all its children. Special Rows and Cols widgets can have multiple children, and impose a fixed height or width (respectively) that you specify for each of its children, thus letting you create complex grids of items.

Similarly, drawing the screen starts at the root-level Screen.render() function call, which then tells its child widget(s) to draw themselves, “bottom to top”. On the one hand, this lets widgets inherit the background color from widgets underneath them. On the other hand, this can cause a lot of overdraw (filling the screen with a solid color takes a perceptible amount of time) and thus screen flickering.
The solution was a separate Screen.renderWidget() method that let you identify which widget in particular had been invalidated. Widgets under that one would then redraw only their area that was directly under the widget in question, and widgets that didn’t overlap with the invalidated widget didn’t do anything. With this in hand, screen updates were much smoother.
To complete the capabilities that would make app development easier, I also pulled out the hardware button debouncing from my summer art project into a separate debounce library, as well as a tiny collections library that offers capabilities like vector<T> even on AVR-based Arduino platforms that have no C++ stdlib whatsoever.
Wifi polling
The Wio terminal comes with a library to interact with its two wifi chipsets (for 2.4 GHz and 5 GHz). It even has an HTTP client! But equally importantly, its wifi can operate as either a client or a base station, and it can enumerate all the nearby signals, along with some metadata about them. Once I had the UI ability to display data to the screen, doing the wifi scanning was actually fairly straightforward:
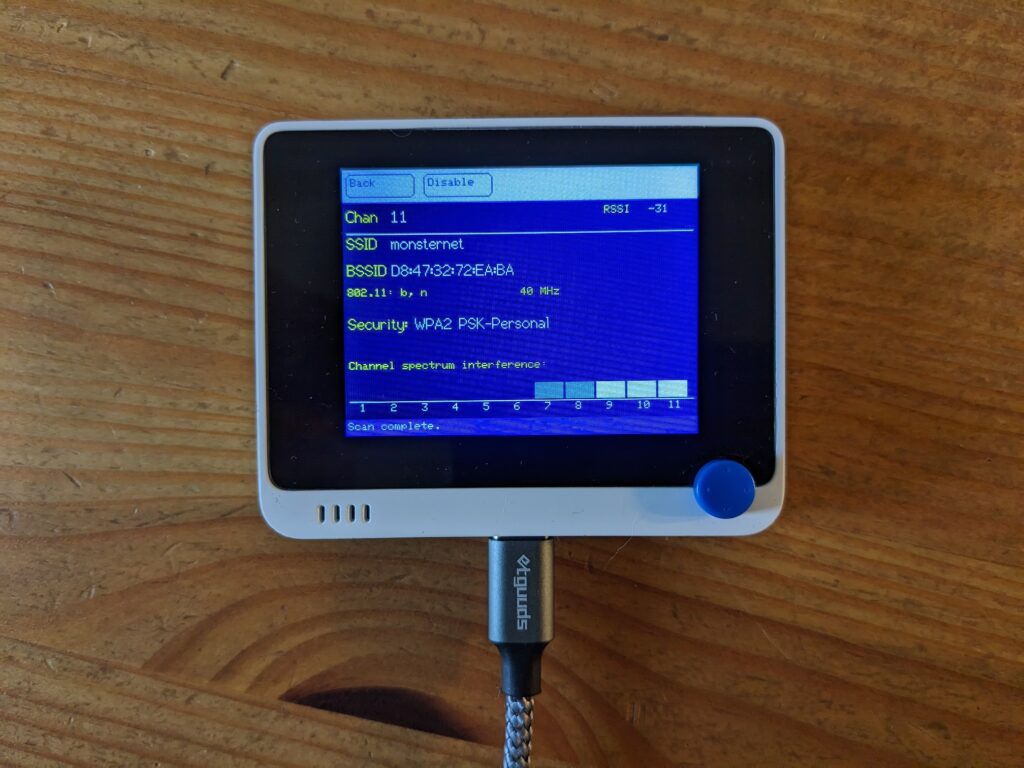
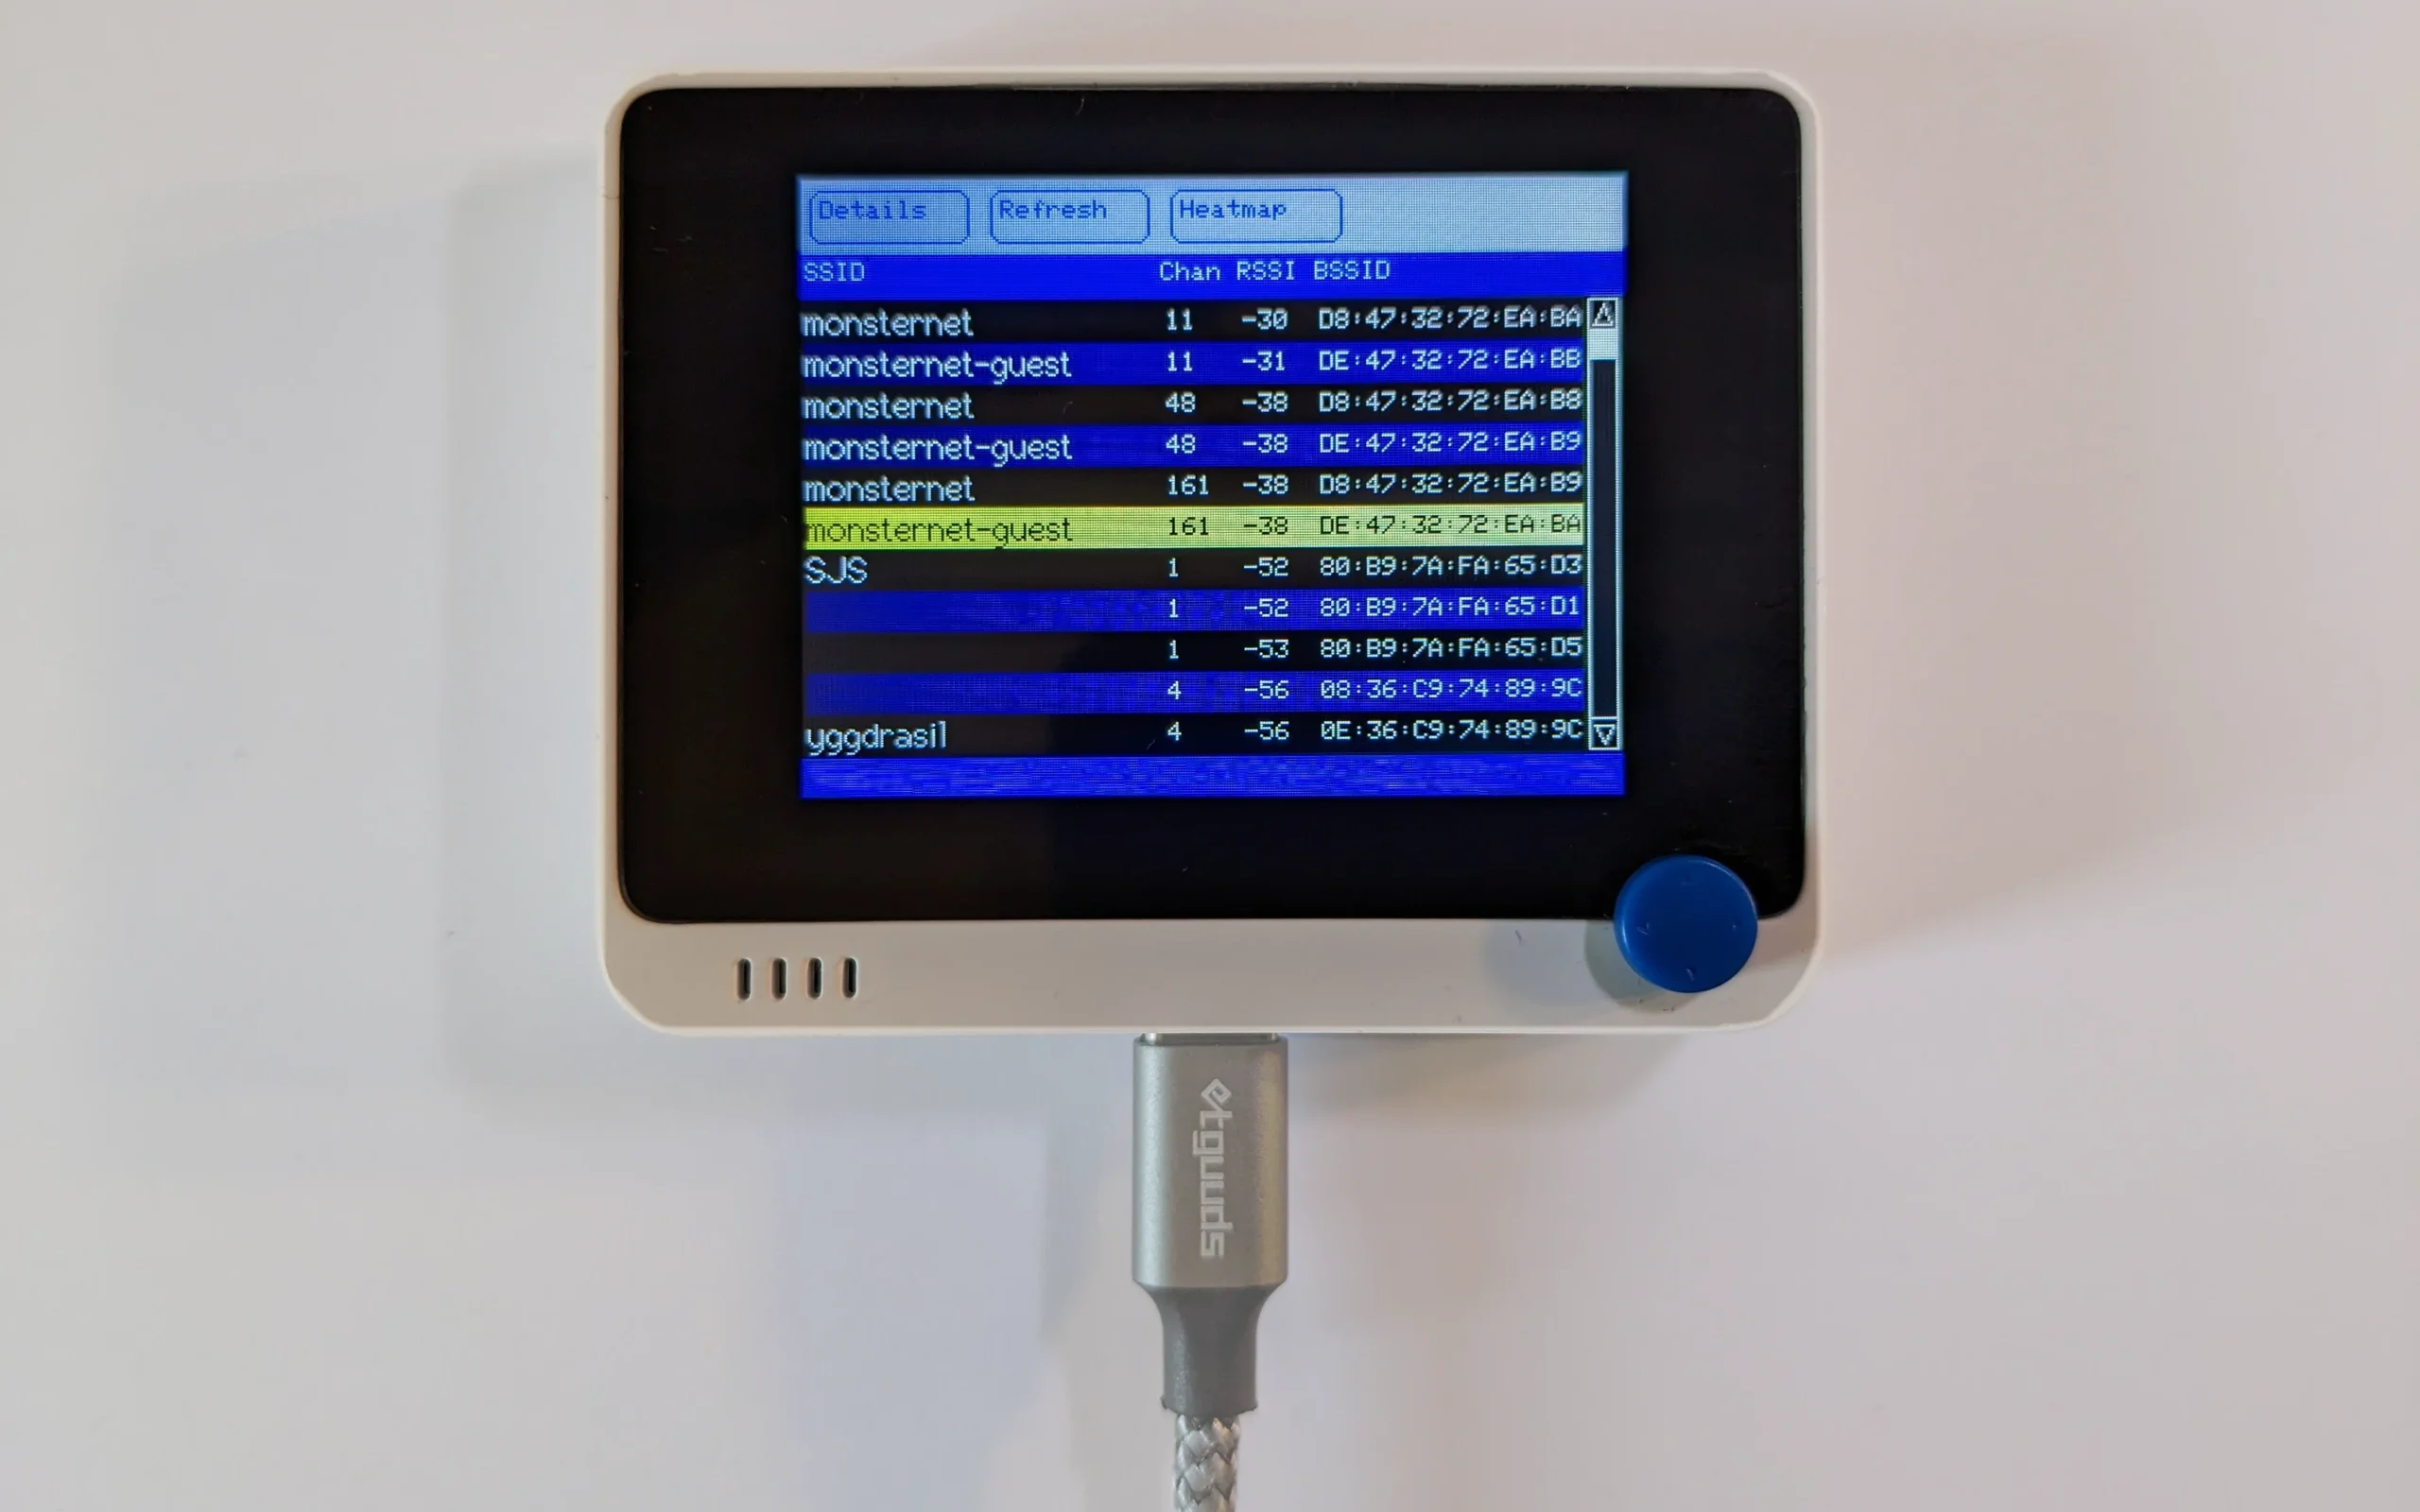
The main display (shown earlier) lists all of the wifi signals it sees. The blue button in the lower right corner is actually a 5-way “hat” that I wired to scroll up and down through the list of wifi signals; pressing “in” on the hat pulled up a specific station’s details, shown just above.
Channel contention
I also aggregated all the wifi signals and calculated (based on their channel number and advertised bandwidth) not just which channel they officially sat on, but which other channels they interfered with. In the image above, you can see that the 40 MHz bandwidth of this station, while configured on channel 11, also overlaps with channels 7–10, although the signal level does drop off as it approaches the edge.
That signal drop-off is defined by the spectral mask for the protocol. 802.11b, for example, has a fairly square-shouldered plan:
Whereas 802.11a and g may have slightly more interference at ±10–11MHz off the center of the channel, but they fall off faster from there:
The “dBr” values in these graphs show how fast the signal power decays. At 0 dBr, it’s “full power” relative to the source of the radio emissions, and -20 dBr is a 10x power reduction. -40 dBr is thus a 100x power reduction, and is basically background noise at that point.
The result of this is that by knowing which wifi protocols each station was advertising, and which channels they were centered on, I could plot the amount of radio traffic in my area from all the different wifi sources around me:
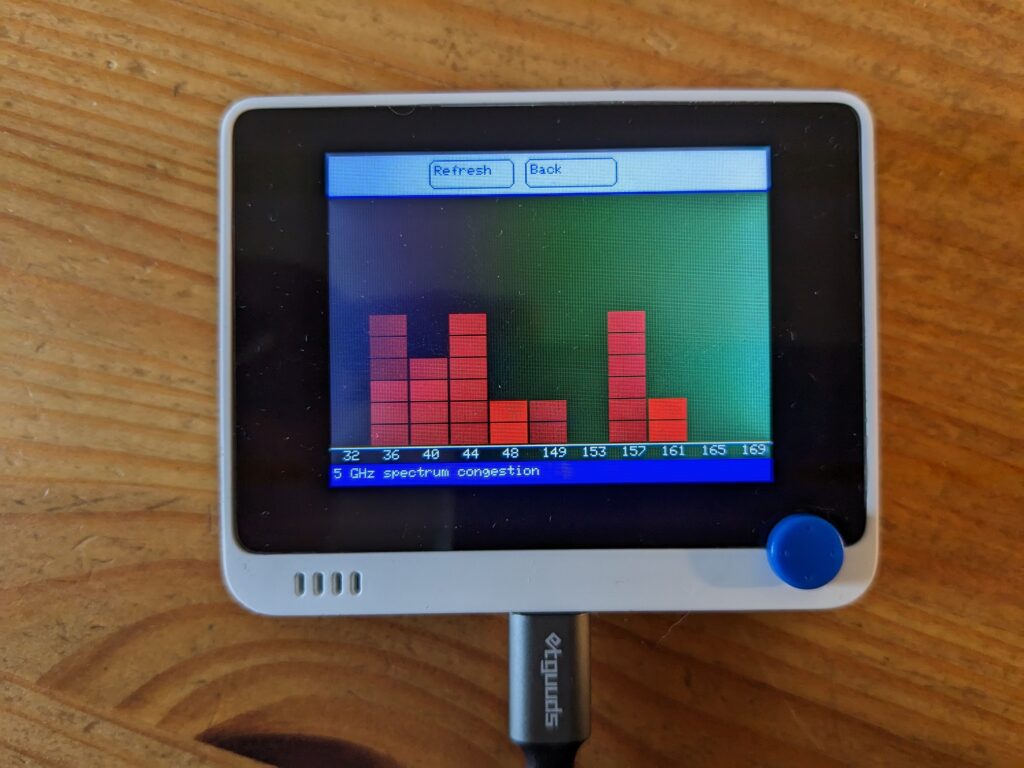
This image shows the channels in the 5 GHz band plan defined by the FCC, and how many stations (SSIDs) were operating on each one. Taller lines mean “more stations” and the brighter each box is, the higher the power level I was receiving (and thus a measure of how much it’d interfere with another signal, like my own wifi).
I also included a feature to “mute” a given SSID. Thus, I could “turn off” my own SSIDs in the heatmaps, without needing to actually shut off my wifi. This gave me a better picture of how to reconfigure my own wifi station for minimal interference (and thus, a clearer road for high-bandwidth communication with my own cell phone or other wifi devices).
Results
I was surprised to find that my AP was not actually making great automatic choices about which wifi station to use. In 802.11 (2.4 GHz) in particular, there are heavy overlaps between channels, and sticking to just the non-overlapping 1, 6, and 11 tends to have the best results. Nevertheless, my AP was on channel 8, and there were a lot of other signals I could see in my neighborhood clustered on channel 6. Setting my base station to use channel 11 would mean dealing with a lot less noise.
The situation is less problematic in the 5 GHz band because the channels are all 20 MHz wide (instead of 5 MHz), so by default they overlap only with other access points with the exact same channel setting. However, in 5 GHz you can gang channels together to create a higher-bandwidth 40 or 80 MHz station, and all the latest Wifi 5 access points do this. In that case you would overlap with your immediate neighbors (though, mercifully, not stations that were 5 channels away like in 2.4 GHz-land). Again, I was surprised to find my router choosing the same channel as my next door neighbor. With this data in hand, it was easier to reconfigure it.
Another advantage of the small form factor of the Wio is that I can measure RSSI—signal strength—from any room in the house, rather than just relying on the AP’s measurements of what it sees from its one fixed location.
Unfortunately, it is difficult to tell whether the wifi is “faster” or not; the actual interference encountered depends on a lot of factors (including, for example, whether my neighbors are downloading something right at the same second as you run a speed test). On the other hand, now I’ve got a troubleshooting tool that fits in my pocket.
Appendix: the code
If you want to use this yourself, the Wifi scanner is here. You’ll need to download the libraries indicated in the Wio terminal wiki to use the LCD and the wifi chipset. (And also follow the instructions there to re-flash the wifi chipset firmware.) There’s no hardware BOM this time; just get the Wio terminal and a USB-C cable for your computer, and you’re all set.
This also relies on the following libraries I wrote, all of which are available in the Arduino IDE in the Library Manager: